
All indications are that school officials and transportation leaders will soon be confronted with the harsh reality of COVID related budget cuts. With expenditures such as driver salaries, benefits, fuel, insurance, and buses themselves becoming costlier, how are districts left to cope without impacting their transportation system?
Many districts are conducting COVID focused transportation operations assessments to highlight areas where the operation could be more efficient, save money, and create a safer form of transportation for its students. In fact, our advisory teams are currently engaged with school districts in CA, TX, NJ, and NY supporting clients by performing COVID transportation scenario modeling, providing COVID operations checklists and identifying where efficiencies and cost savings could be realized.
The questions being asked by our clients are the same questions that districts across the U.S. will be asking: What can you do to prepare for schools to reopen under COVID restrictions and how to prepare for the likely cuts in funding?
Understanding the budgeting process is a good first step. For example, there are two parts to the transportation budget:
• The Expenditure side: Driver salaries, benefits, fuel, new bus acquisition
• The Revenue side: State funding, Medicaid reimbursement, field trip reimbursement, paid riders
Transportation leaders have traditionally focused on expenditures and how to change their operations to influence cost. Considerations like bell time changes, routing assessments, fleet replacements that help minimize total cost of ownership, and software purchases are all proven methods of attacking the cost question. However, we all know we will never drive the cost to zero without putting ourselves out of business, so we also need to be aware of how transportation is funded.
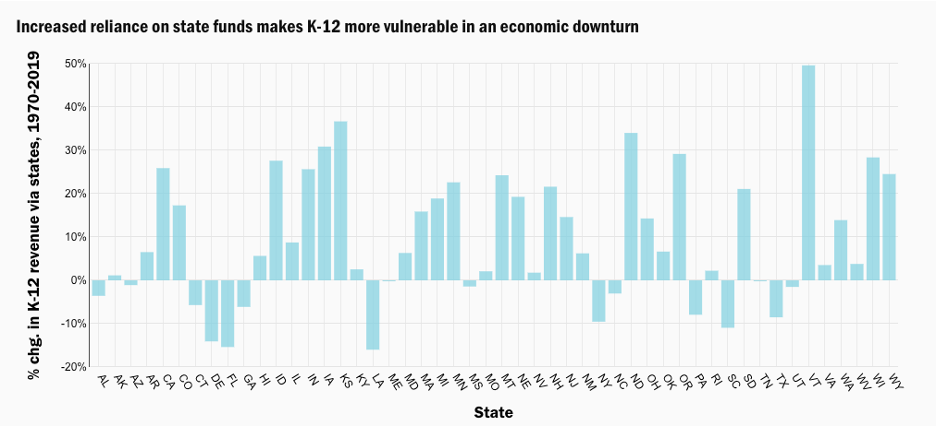
By understanding how your revenues are received — particularly your state funding approach — you can help design your service to best balance expenditures and revenues.
- 47% of K-12 funding comes from states
- The majority of state revenue (almost 90%) comes from state sales and income taxes.
- Consider that retail sales started to decline in February and were followed by unprecedented state unemployment numbers, which directly impact overall wages and taxes.
- State sales tax revenue decreased first, but that will be followed quickly by very large reductions in income tax revenue.
- 44% come from localities
- Property taxes are a function of your home’s assessed value multiplied by the tax rate your town or municipality imposes. That assessed value is approximately what your home would sell for if you were to list it on the market. If your home’s assessed value is $400,000 and your local tax rate is 2%, you’re looking at an annual $8,000 property tax bill.
- According to the Brookings Institute it’s possible that foreclosures in property-tax-dependent cities will take place at an expedited rate and will drive property tax revenue down starting in 2021.
- 8% from federal
- CARES act provided $16.2 billion in aid to fund public education. CARES education funding is equivalent to only 1.9% of K-12 education revenue in the 50 states and Washington, DC, in the 2020–21 school year. This additional federal education funding is equivalent to only 1.9% of education revenues.
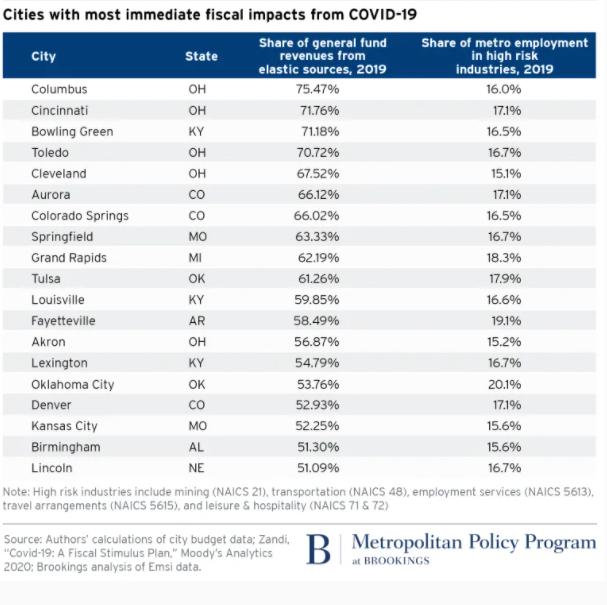
The cities that are reliant on sales and incomes taxes with a high share of vulnerable industries (restaurants, tourism, auto, retail) are likely to feel fiscal declines in June and July. New York’s Rochester City Schools rely on the state for more than 75% of the district’s funding, whereas Scarsdale Union gets more than 90% of its money from local sources.
Others will feel COVID-19’s economic effects in the next few quarters to a year. Some preliminary estimates from states are showing state revenue drops of between 10% and 20%. These drops are likely to be even larger in 2021–22, when the income tax effects will be felt more fully. During the housing crisis recession school districts were forced to take drastic measures to meet radically lower budgets. The initial measures included hiring freezes, no travel, reduce vendors, identify operational efficiencies, and reduce headcount. For example, in 2009 Nevada’s Clark County SD laid off over 500 employees.
To fully evaluate the impact of changes to transportation, you must understand how your state’s funding approach works and what it is trying to accomplish. There are four general types of approaches used to fund transportation. They include:
• Transportation block grants: Funding is provided as part of basic per-pupil foundation grants.
• Per unit allocations: A fixed amount of funding is provided based on a specific unit of measure (e.g., per student, per mile).
• Approved costs: A certain percentage of all costs incurred within specific categories are reimbursed (e.g., 85 percent of driver salaries).
• Efficiency formulas: Funding is provided based on operational efficiency rather than cost.
Knowing how your state’s funding approach works will help you avoid making bad choices that appear to be good.
For example, many states have set minimum walk distances to school for purposes of funding. If your district decides to exceed those distances to try to reduce cost, this may seem like a logical strategy. However, if the revenue you lose by not transporting these students exceeds the costs you reduce, this approach becomes illogical. Only by understanding the full impact on expenditures and revenues can you make a “good” decision about where to set walk boundaries.
The more you understand your state’s approach to funding, the better able you will be to explain both the operational and financial impacts of changing your approach to address the realities of the COVID pandemic. To learn more about how TransPar can help your district tackle its transportation budget, please visit our COVID Services page.